Page Content: Diversity Snapshot | Diversity Dashboard Info | Diversity Dashboard | Additional Dashboards and Reports
DIVERSITY SNAPSHOT
|
|
Note: All of UNC Charlotte's data is maintained by Institutional Research and Decision Support unless otherwise noted. A UNC Charlotte login is required to access all non-public data and reports. |
Click here to access our Diversity Dashboard
STUDENT DATA
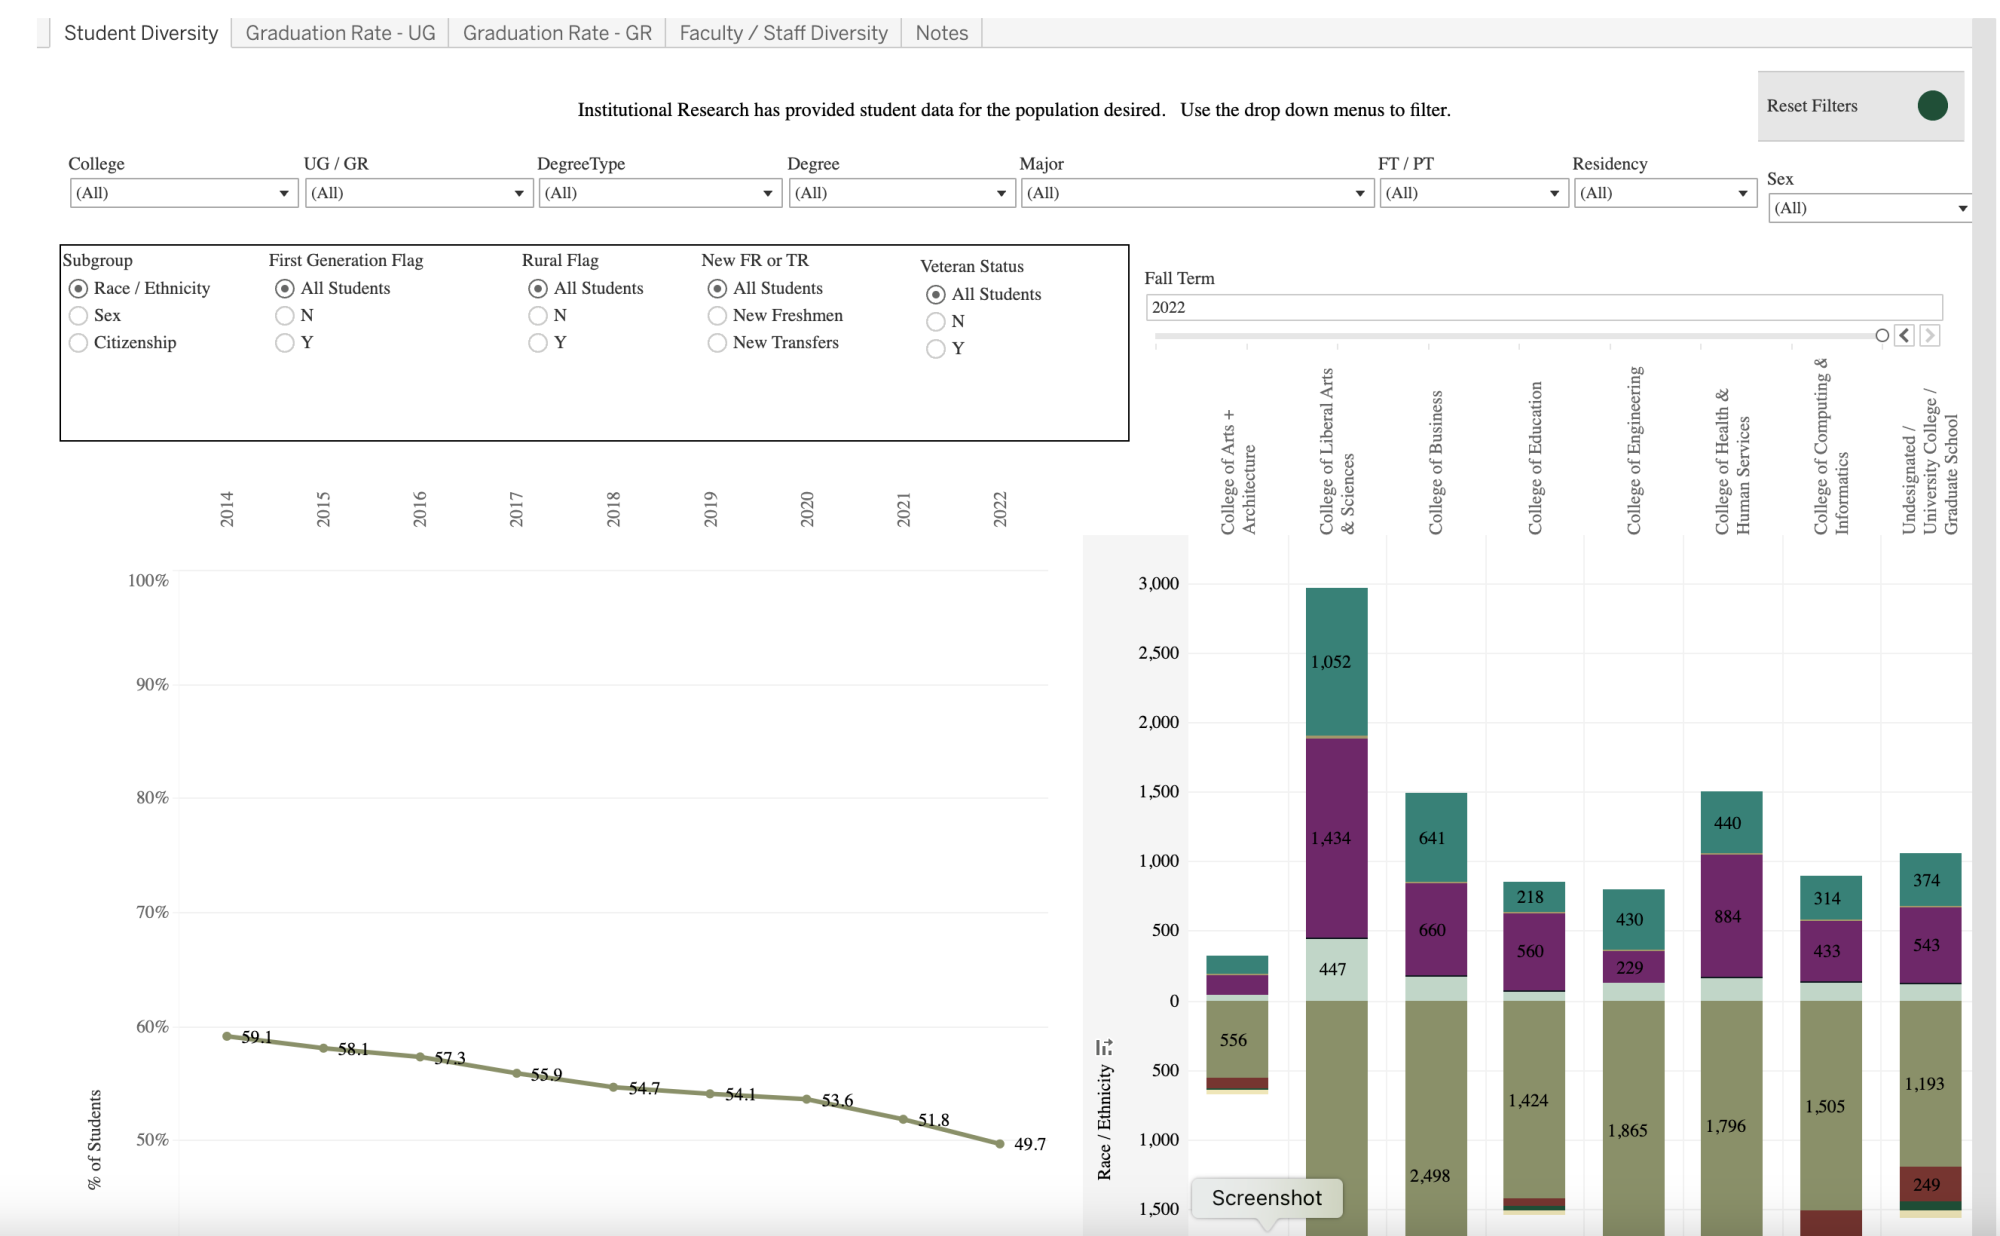
- Numerical, percentage, and trend demographic data by self-reported race/ethnicity, sex, citizenship, new freshmen or transfer, first-generation, rural, and veteran status
- Numerical, percentage, and trend data for student demographics by college, undergraduate/graduate, degree type, degree program, major, full-time, part-time, and residency
- Undergraduate and graduate graduation rates by student demographics
FACULTY + STAFF DATA
- Numerical, percentage, and trend demographic data by self-reported race/ethnicity, sex, EHRA/SHRA, for faculty and staff
- Numerical, percentage, and trend data for faculty and staff demographics by employee status, and college/unit
- Numerical, percentage, and trend data for faculty demographics by employee status, tenure, and college/unit
Sample collapsed text here.
Sample collapsed text here.
ADDITIONAL DASHBOARDS AND REPORTS
ACCESS DATA
SUCCESS DATA
- Graduation trends by term, honors recognition, NC county origin, and ethnicity
- Graduation statistics by term, honors recognition, NC county origin, and secondary major
- Undergraduate-level retention and graduation
- Graduate-level retention and graduation
- Faculty tenure by college
- Mentor training for faculty